
13 useful insights on how to better perform as a Car Dealer using Google Analytics
28.07.2024


Michał Karpiński Volkswagen Group Polska, Piotr Ulacha, Senior Digital Analyst
In every industry, the use of data from analytical systems such as Google Analytics or Adobe Analytics to make business decisions is good practice.
In this article, Michał Karpiński, Digitalization Manager at Volkswagen and Piotr Ulacha, Senior Digital Analyst at Artegence will take a closer look at the automotive segment where, according to Google, 90% of new car buyers perform their product research online before visiting their local dealership.
The recommendations we have collected in this document are the results of long-term cooperation between Artegence Sp. z o.o. and Volkswagen Group Polska Sp. z o.o.

From my perspective as a person representing the automotive industry, I see that awareness of the importance of data for business is still growing. Based on our experience, I can say that thanks to proper data tracking, integration of various data sources and accurate interpretation, we are able to make better decisions
Michał KarpińskiThe purpose of this publication is to inspire car dealers to use analytical data from their websites. In the article we will show what types of reports and functions are particularly useful for this type of business. We will also indicate what business questions data can help us answer.
Below is a list of basic recommendations that every car dealer should be able to apply in their activities with the help of a digital analyst. The following list has been ordered from simpler to intermediate solutions.
The following statement is not a complete list of all the ways that Google Analytics can support your business. We hope, however, that it will provide a reliable base by which you will expand your level of data usage when conducting marketing activities.
1. GEO reports
Geo reports provide basic geographical information on your audience such as city, country and continent. The values for these dimensions are automatically derived from the IP address of the hit.
For a car dealer whose business is based on the local market, location-based data analysis can be crucial.
Use case of GEO reports
Suppose we have a car dealership in a big city. Most of our clients are residents of this city. Because there are several other smaller towns or cities in our region that do not have a strong dealership representation, we want to reach these locations with our advertising.
How should we identify new locations to expand our advertising reach? Should we choose the largest of them in terms of population? We would probably do that if we did not have access to analytical data.
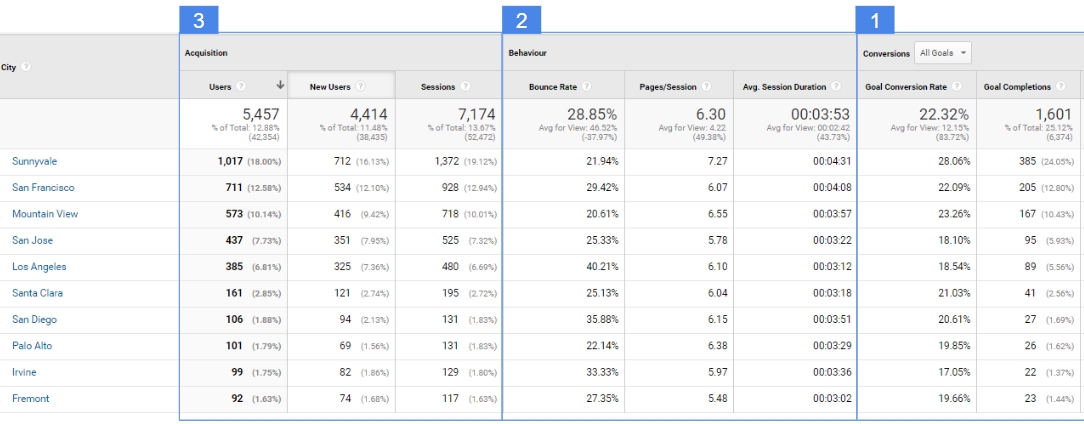
What analytical data should we pay attention to in this case? First of all, for conversions (no.1 in the picture above) generated by individual cities. If we want to allocate the advertising budget well, we should choose those cities that have a high conversion rate for the most important goals on our site. If individual locations perform better in organic traffic than others, then there is a high probability that they will also achieve better results in paid activities.
We should also focus on engagement (no.2 in the picture above). Locations with a long visit time, a high visit depth and a low bounce rate will determine those locations requiring our attention.
Finally, we can look at the volume of traffic (no.3 on the picture above) from specific locations. This will allow us to estimate the magnitude of interest in these places.
Having a user profile defined, we can implement campaign optimization in terms of age, gender or interests.
2. Device reports
The device report provides us with information about which devices are used by visitors to our site. Importantly, the report can also indicate to us whether users using a specific category of devices are characterized by a higher level of engagement or conversion rate or not.
For several years now, we can see a decrease in the number of people using desktop devices in favor of mobile devices. For a car dealer, mobile traffic can be very important especially if its core business and the largest source of its revenue is car servicing. When drivers notice the service indicator light in their car, their first reflex may well be to pull out the mobile phone.
However, when the user is thinking about exchanging their car for a new one, it is probably not so obvious which device will be used for this purpose.
Use case of Mobile reports.
Let’s assume that we want to launch an advertising campaign acquiring new clients for car servicing. We want to see if we can optimize campaign settings by narrowing down the activities or putting emphasis on a specific type of device.
Without access to data, we would probably run campaigns optimized for all devices. Conducting a survey among our website’s customers regarding the type of device they used to find our website does not seem to be a good solution.
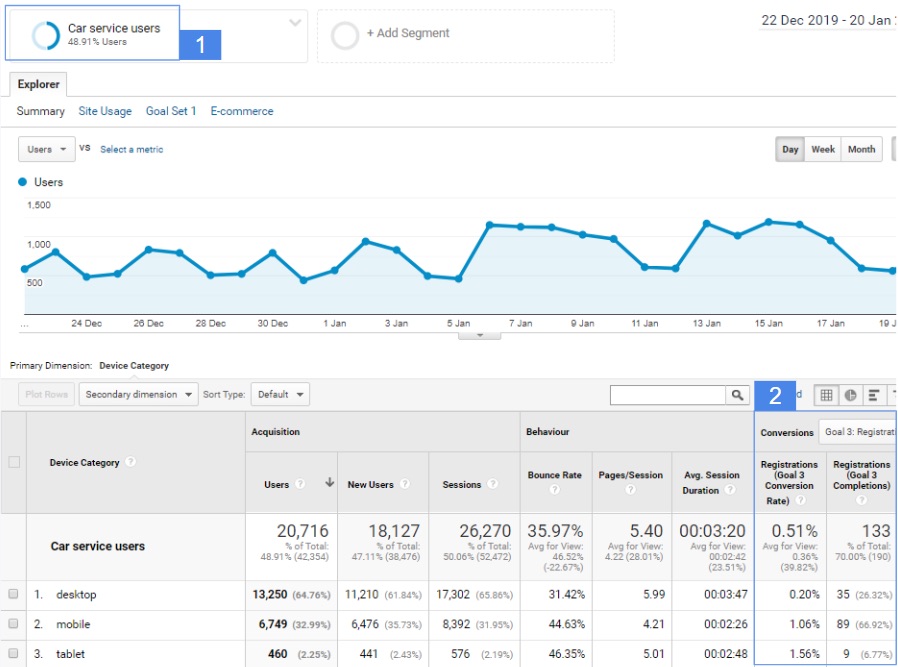
However, if we have access to data from the analytical system, we can easily check which devices performed better so far when it comes to the offer of car servicing. We can achieve this by checking data for the segment of users interested in the service offer (no.1 in the table above). Then we check the conversion rates for the goal defined, for example, as entering the contact tab from the service tab, or completing the service price quote form (no. 2 in the table above).
Having knowledge about which user devices perform better for a specific purpose, we can optimize the settings of our campaign relative to those devices.
3. Acquisition reports
One of the most frequently analyzed reports in each project is the traffic acquisition report. With its help, we are able to check which sources generate traffic on our website and which of them meet our business goals best.
Using this report, a car dealer can see which part of the money invested in advertising pays off best.
Use case of Acquisition reports.
Let’s assume that due to sales plans next month we need to get 100 contact leads from users interested in new cars.
The first question we want to answer is which advertising channel will bring us these leads in the most effective way. The second question we will want to answer is how much traffic we will need to achieve the assumed goal. The last question is how much budget should be allocated to achieve this goal.
Without access to analytical data, we will not be able to answer these types of questions.
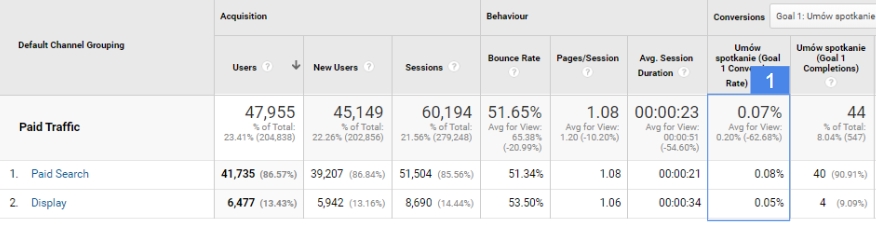
However, having data in the acquisition report, we are able to check which traffic channel, source, medium or campaign has the highest conversion rate for a specific purpose (no. 1 in the table above). Then, in order to calculate the amount of traffic we need to get x leads, we can use the formula:
Number of session = (x leads * 100) / conversion rate
Knowing the amount of traffic needed and approximate costs of obtaining it, we are able to estimate the budget needed to achieve our goal.
4. All Pages reports
Site content reports show how users interact with our site. Reports show from which pages users start browsing our site (landing pages) or, after viewing, which pages they exit the site (exit pages). The All Pages report is able to show us which content is characterized by high engagement or which pages have the most conversions.
For a car dealer, there are many scenarios for which content reports can be useful. Just like any other website owner, a car dealer should also know and benefit from information about which content on the site best meets his or her business goals.
Use case of Site Content reports.
Let’s assume that we run a social profile on Facebook and we want to share on it or sponsor a link; a link to an article on our site that could generate significant interest among users interested in the automotive industry.
Without access to analytical data, it would be difficult to determine which of the content on our site may be good for this purpose. We would have to be guided by intuition.
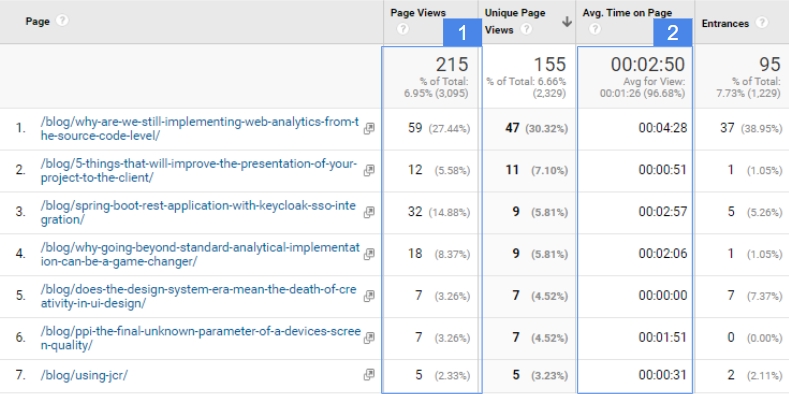
To choose the right article based on the data, we should pay attention, first of all, to which publication has the highest recent viewership (no. 1 in the table above). Next, we can check which of the most popular articles is characterized by high user involvement measured by average reading time (no. 2 in the table above).
The article that generated a lot of organic interest will probably also have better engagement results on social media than the other publications on our site.
5. Landing Page reports
Like the All pages report, the Landing Page report is available in the Site Content reports section. The Landing Page report is one of the most useful reports available in this section. This report allows us to check which pages bring traffic to the site and thus from which pages the user most often starts their visit.
Use case of Site content reports.
Let’s assume that as a car dealer, we set a goal for our future advertising campaign to acquire as many contact leads as possible. Because the campaign is not about a specific product or service, we have doubts about which page should be our landing page.
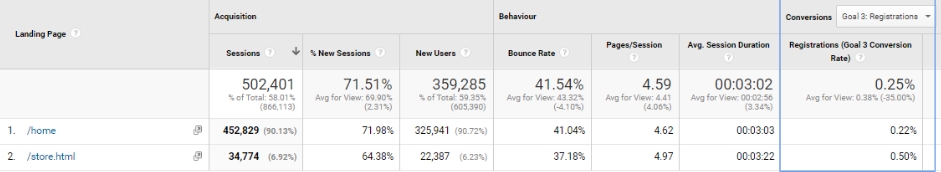
For this purpose, we should check in our Landing Page report which of the sites that has the highest conversion volume also has a high conversion rate (no. 1 in the table above). It may happen, as in the example above, that it is not always the best idea to direct users from the campaign to the main page.
6. Demographics report
Demographics reports provide us with information about the user profile of a visitor to our website. Using this report, we are able to find out the age, gender or location of users performing certain activities on our site.
Use case of Demographics reports
Let’s assume that we run an advertising campaign aimed at getting the highest number of clients for a car service while maintaining the highest possible efficiency of the budget spent.
How can we use the data from our analytical system to achieve this goal? For example, if you want to check the age of the users who are most likely to leave a lead on the site, we have to follow the following steps. First of all, we define the segment of users visiting the service section on our website. Secondly, we check which age category generates the most leads and which has the highest conversion rate.
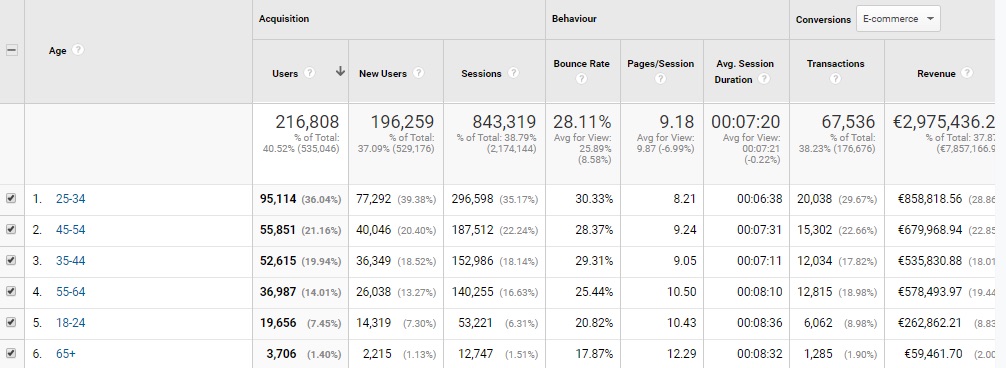
We should compare age data with gender and user interests data. In this way we get a pretty precise user profile, which in the case of our advertising campaign should have a high conversion rate.
The next step is to optimize the campaign based on the data we have drawn up. It can be limiting the display of advertising to only users with a specific profile, or applying higher per-click rates to them. All in order to reach the most promising target group with our advertising – before our competitors do.
Remember to activate Demographics reports on the Google Analytics account. By default, they are not active, and without this setting we will not be able to start collecting data of this type.
7. Integration of Google Analytics with Google Ads
In an analytical system such as Google Analytics, we have the option of importing data from the advertising system. If our campaigns are conducted using the Google Ads network, we can see the advertising data in our reports after integrating Google Ads with Google Analytics. In this way, we can have access to data that is managed by advertising agencies on a daily basis.
By integrating both tools, we are able to make advanced analyses of advertising campaigns without involving an advertising agency.
Use case of Google Ads and Google Analytics integration
Let’s assume that we need to limit the budget of an advertising campaign acquiring clients for a car service. However, we want it to be as painless as possible, meaning a minimal loss of the number of potential leads.
One of the options for optimizing such a campaign is to narrow down the Ad Schedule to the hours and days of the week that are most likely to get a lead. In the Google Ads system, we are able to limit the display of ads to specific hours or days or apply higher rates for clicks at that time.
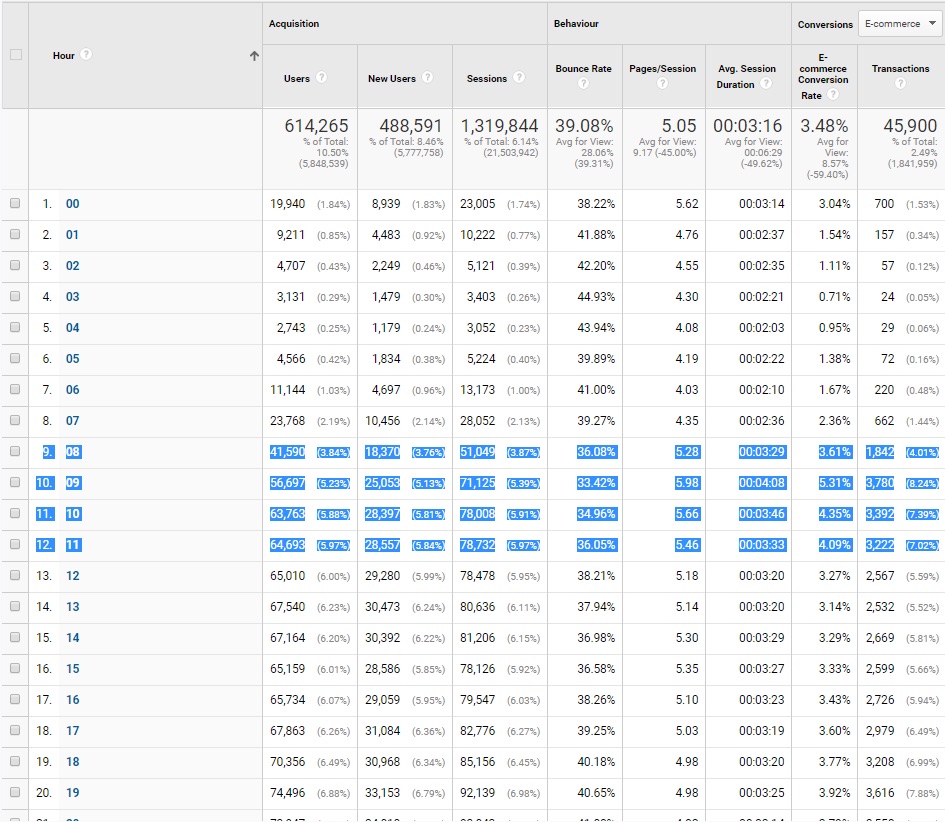
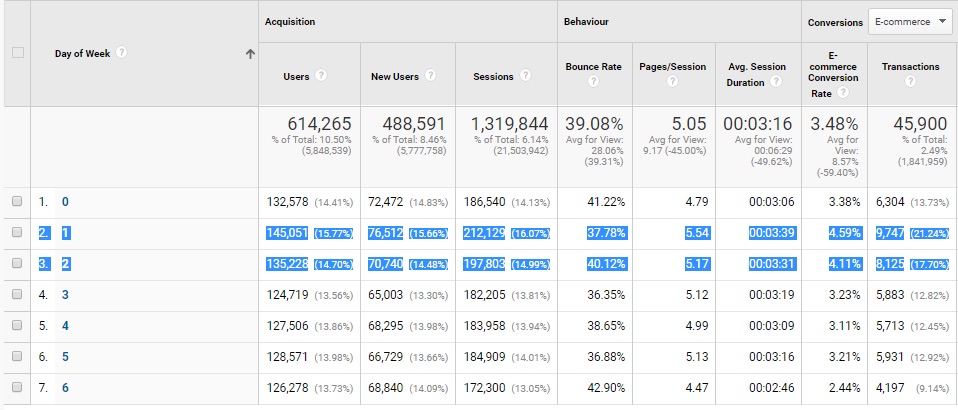
In the Google Ads Section reports on hours and days, we are able to select both the hours and the days when our advertising budget is spent more efficiently and in this way are able to optimize our advertising activities.
8. Integration of Google Analytics with Google Search Console
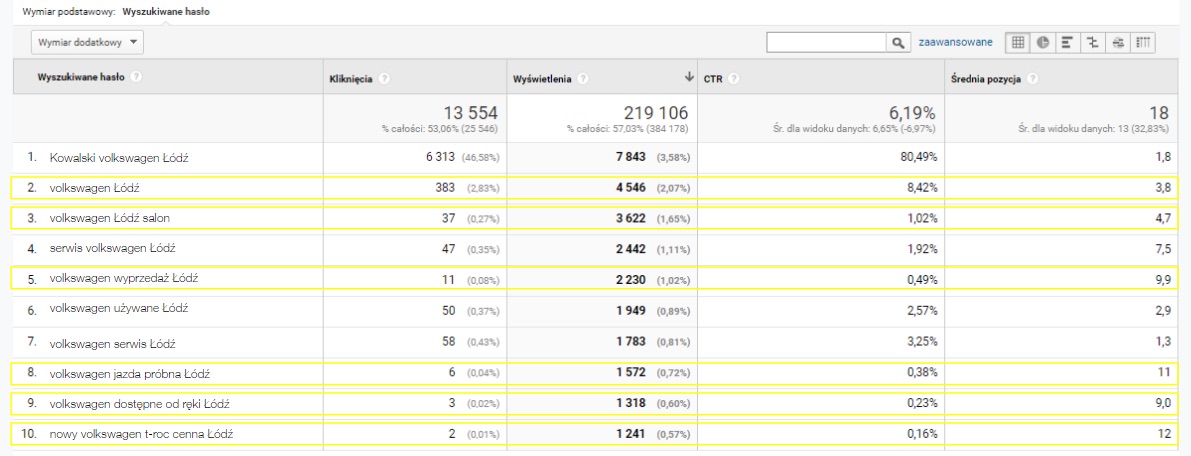
The integration of Google Analytics with Google Search Console gives us a direct opportunity to analyze data on organic search results in Google Analytics. Thanks to this integration, we gain the ability to:
Check the position of our website in organic Google search results
Choose key phrases for an advertising campaign; phrases with high potential and a low position in the search engine
Select phrases to improve our position in organic search results; phrases for which traffic is characterized by high engagement, but our position limits the volume of traffic that we could get if our site was higher
Select pages for CTR optimization. In the Landing Pages report, we have the opportunity to check what CTRs our individual pages have in organic search results. By experimenting with Meta tags (title and description), we can try to improve our results
Use case of integration of Google Analytics with Google Search Console
Let’s assume that we want to run an advertising campaign in the Google search engine using Google Ads. In order to optimize the budget, we would like to avoid showing our ads for the phrases that are already high in organic search results.
Without access to data from the Google Search Console, it would be difficult for us to determine what organic phrases generate traffic on our site. In addition, without using additional tools, we can check the current position of our website in Google Analytics based on these phrases.
Therefore, in the Google Analytics acquisition section, we select Search Console items and use the Queries report. We sort the report according to the most popular phrases in terms of views. For the most popular phrases, we choose phrases that also have a lower position in the search engine, for example if they are not in the first three positions in organic search results.
9. Model attribution
If our business is related to the automotive segment, we must be aware of what attribution is and what are the basic models used in data analysis. Knowledge of this type is useful in every market segment, but for the automotive market, where the decision to buy a new car is not usually made when the user first enters the site, is particularly important.
It’s good to know that most reports available in Google Analytics work based on Last Click non direct attribution. Therefore, the merit for acquiring a contact lead is attributed to the last traffic source, which is not a direct entry.
What are the implications of this? We should be aware that if our campaign in standard acquisition reports does not acquire leads, it does not mean that it is not an important element of the customer journey which generates a lead.
User contact with our campaign may occur at the beginning of the path or close to conversion, but in most Google Analytics reports that are based on Last Click attribution, we will not see our campaign as a lead acquisition campaign.
To better determine the potential of individual campaigns or traffic sources, we should look more frequently in the Multi-Channel Funnels report section.
Use case of model attribution – evaluation of social media campaigns
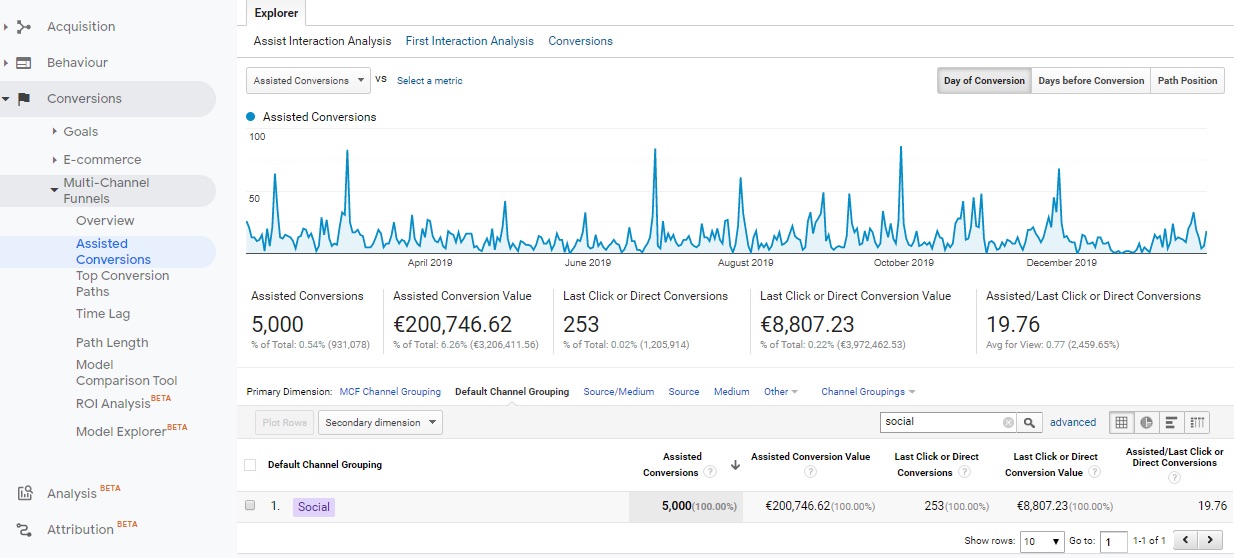
Let’s assume that in recent weeks we have conducted a Facebook campaign acquiring leads on the website. The results visible in standard reports (based on last click non direct attribution) in terms of acquiring new leads are not commensurate with the amount of expenditure incurred for the campaign.
The first step should be to check in the Assisted Conversions report whether the social media channel or the specific campaign we carried out on that channel does not support more conversions than it generates. It may turn out, as in the screen below, that the campaign conducted by us does not directly generate a large amount of conversions (last click or Direct Conversion Value) but the amount of conversions that it supports (column assisted conversion value) cannot be overestimated.
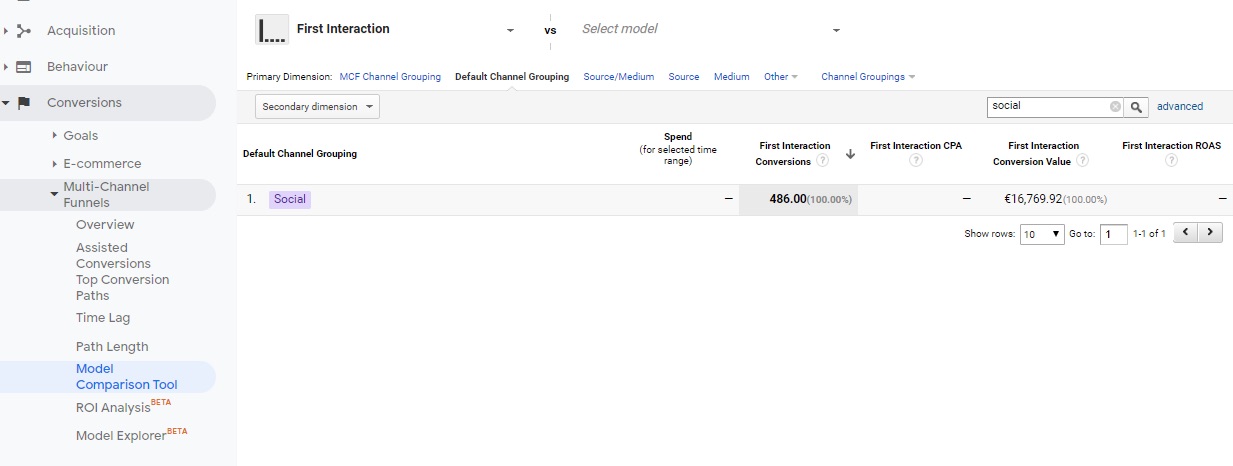
Then, to check where a campaign or social media channel appears on the path, we should use the attribution model comparison report. Looking through the next attribution models, we can come to some interesting conclusions; for example, in the first click attribution a given channel or campaign can get twice as many conversions than in the last click attribution model (as in the screenshot below).
The most advanced model, taking into account the largest number of variables, is the data-based attribution model. If the scale of our business is large enough, this model can provide us with the most reliable information about the real value of the advertising channel we are analyzing.
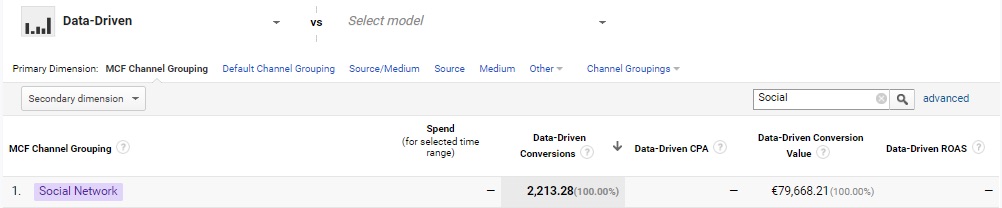
The above information gives us a more valuable picture of the situation and a reference point useful for making a decision whether to, for example, continue the campaign using the social channel or not.
10. Tracking of external campaigns
We usually find out what external campaign tracking is when we want to analyze the effects of an advertising campaign carried out with an advertising tool not integrated with Google Analytics, such as a Facebook campaign or an email campaign.
For each such campaign, it is necessary to tag all links to our site using special media parameters. A link to the tool that generates such media links can be found at: https://ga-dev-tools.appspot.com/campaign-url-builder/
Use case of tracking of external campaigns – evaluation of email campaigns.
Let’s assume that we recently conducted an email campaign using various creations. We are planning to resend the campaign to a new user base soon. We need to know which of the creatives for the previous campaign generated the most conversions and had the highest conversion rate.
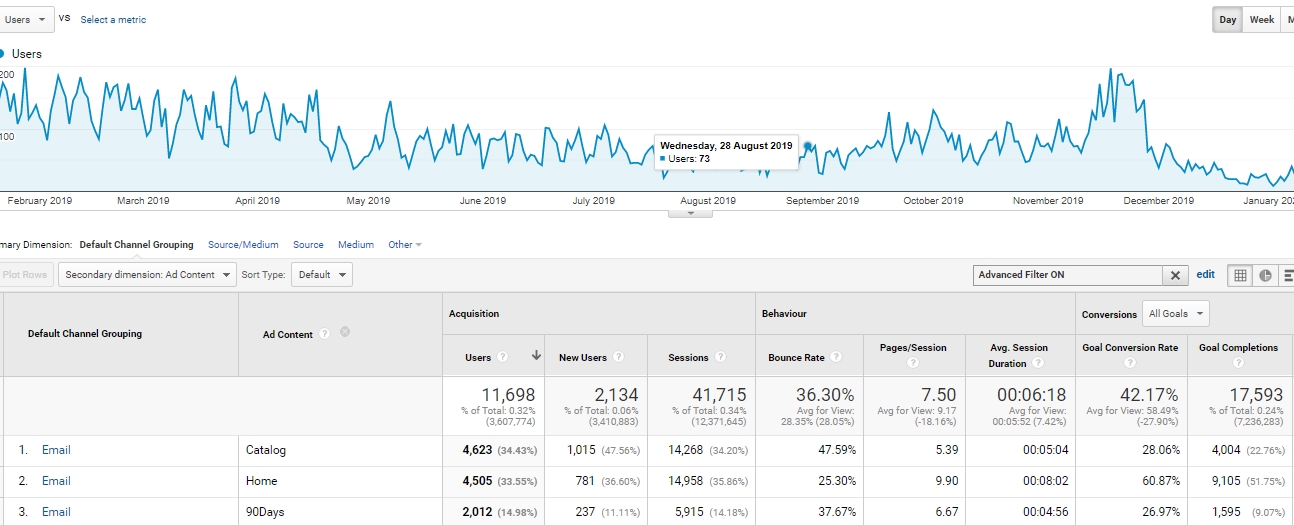
By adding the appropriate tags to each email creation, we are able to check which content has generated the most conversions using the Google Analytics acquisition report. The version of the email campaign (Ad content column) that has the highest conversion rate will be the one you want to resend.
11. Remarketing lists + Google Signals
Remarketing lists allow us to gather users in an analytical database by grouping them by a specific behavior that you define. Once you define the list of recipients, it begins to gather users who meet the conditions you specify.
Remarketing lists can be used in advertising campaigns to target one or more specific user groups.
You can create multiple remarketing lists. When defining your remarketing lists, you should consider the option of using them later.
If the sale of automotive accessories is an important part of your business, you should consider creating a separate remarketing list to gather users who visited the accessories page or viewed a specific category dedicated to car accessories in your online store.
Remarketing lists also require you to define their lifetime. We need to decide how long user data will be stored on it. Depending on the type of business and scale of website traffic, you can decide to store data about users for 1 to 540 days (in the Google Analytics system).
Use case of remarketing lists
There are many scenarios for the practical use of remarketing lists. Let’s assume, however, the following specific scenario. For some time on our website there has been information about the premiere of a new car model.
Three months have passed from the moment of its publication to the appearance in the model on sale in showrooms.
Since we already have a new model in our showroom ready for sale, we would like to run an advertising campaign to attract new customers willing to buy this model.
To use our advertising budget as effectively as possible, we should first use the power of our remarketing lists and use them in the ongoing campaign in the Google Ads tool for example.
With the help of remarketing lists, we can reach people who have been interested in new car models within the last 3 months. We can define interest as a visit to the new model section, with time spent set to higher than one minute.
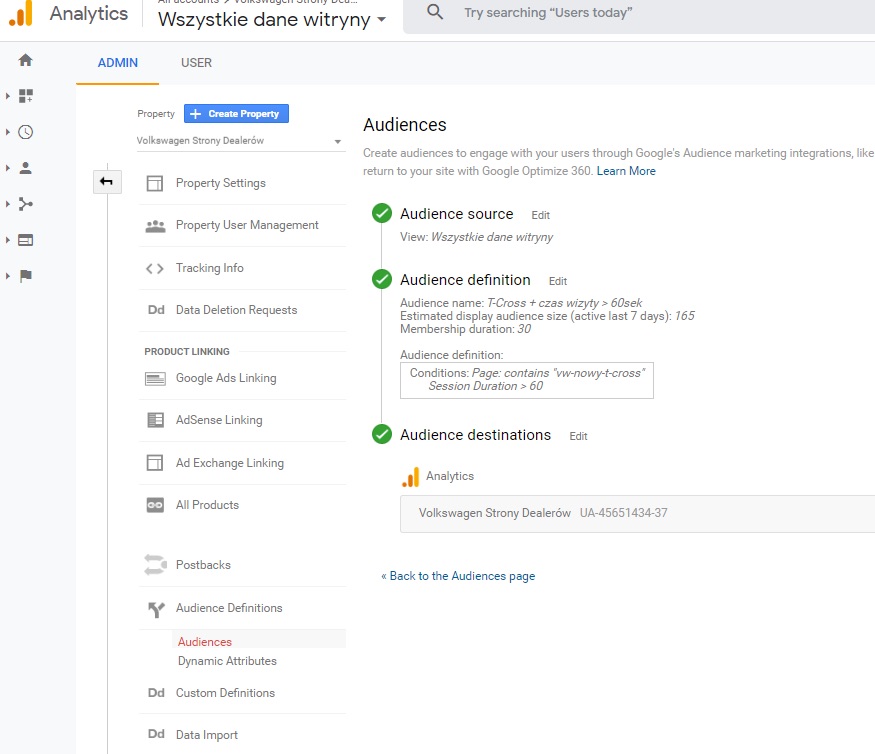
Let’s assume that users who meet the above criterion in the last 3 months are gathered on our remarketing list of 100,000. This is an ideal target group to reach with our advertising. It is highly probable that the results of such a campaign will be better than for a campaign without referencing the remarketing list.
Then, if we have a higher advertising budget, we can target advertising to a wider audience such as people interested in our brand.
Also remember to activate the Google Signals function in your Google Analytics account (https://support.google.com/analytics/answer/7532985?hl=en) through which you will be able to reach users from your remarketing lists to a greater extent, regardless of the type of device they use.
12. Google Store Visits
The weak point of online advertising campaigns is the inability to reliably measure how they affect our offline business. In particular, measuring how advertising campaigns contribute to visits to our fixed point of sales.
The Mountain View company, well aware of this problem, has implemented a new type of Google Analytics report: Store Visits, which is still in Beta at the time of writing. With the help of this new type of report we are able to:
See the number of visits to your business’s physical locations from users who visit your website
See which channels (paid and organic) and campaigns drive the most visits to your stores
Make more informed decisions about ad creatives, spend, bid strategies and other elements of your campaigns
Use case of Google Store Visits
Let’s assume that we are currently conducting a sell-out campaign aimed at selling as many cars as possible.
We know by means of statistics how many people visit our website from individual channels and advertising campaigns. We know how many people leave contact leads. However, we do not know how many people after checking the offer decide to visit the car showroom.
Running Store Visits reports in Google Analytics can, however, change this situation and solve our problem. Thanks to these reports:
We can find out how many people visit our showroom after visiting our website:
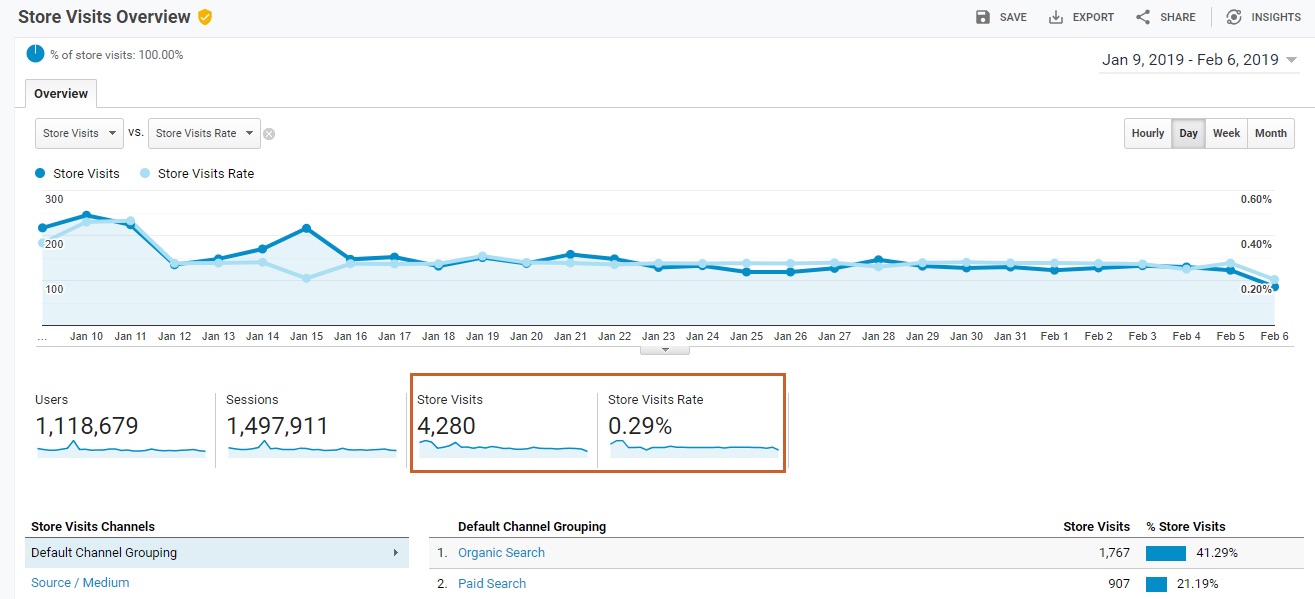
We can find out through which channel, source, or campaign we obtain the most – and most effective – visits to a fixed point of sales.
We can also find out where your store visits come from and use a report similar to using the standard Geo report in Google Analytics.
If you decide to implement this solution yourself in your company, more information on this topic can be found at: https://support.google.com/analytics/answer/7573498?hl=en&authuser=1
13. Integrating data with a CRM system
Last but not least comes the integration of analytical data with our CRM system. Regardless of the technical way you solve this aspect, if a part of your sales takes place away from your website, it is important that you integrate traffic data on your website with data regarding customer service.
Use case of data integration with CRM
Suppose you have a test drive registration form on your car dealership page. Thanks to the appropriate tagging of traffic you know exactly which traffic is responsible for what number of completed forms. However, you would like to go a step further and know which traffic channels or campaign contributed to the fact that after a test drive, someone decided to buy a car.
There are several technical solutions to achieve this. One of them is sending, with each lead passed to the CRM system, information about the source of traffic that contributed to the implementation of this action. After a test drive and buying a car, thanks to information on the source of the lead we will be able to report which channels or campaigns contributed to the sales of cars.
We can also send feedback on car sales from CRM to Google Analytics using (for example) data import.
If you use a CRM system that has built-in integration with the analytical system, just make sure that everything is properly integrated.
As you can see, data is not just numbers. Data can be used in our daily operations to optimize business goals. You do not have to immediately subordinate all your decisions to data. Start with small steps to convince yourself of the effectiveness of this approach. Once it get into your blood, it will be hard to resist not using data at every opportunity.