
How many online users visit your stationary points of sale?
28.07.2024


Piotr Ulacha, Senior Digital Analyst
Your company is present on the internet. You have a website.
You run online advertising activities. You measure everything using Google Analytics or other tools.
You know which advertising channel is responsible for what part of the traffic or online sales. However, there will still be “old-fashioned users” who, after entering your website, will prefer to make a purchase or contact at a stationary point of sale. How many such users are there?
76% of people who search on their smartphones for something nearby visit a business within a day—and 28% of those searches result in a purchase – according to Google. Is this your case or not? Can you apply these statistics to your business?
Until now, you haven’t had the option in Google Analytics to check how individual marketing activities carried out on the Internet contribute to increasing traffic at brick and mortar stores. You had the store visits report in Google Ads but it reported only your paid google campaigns.
Thanks to the new report in Google Analytics called Store Visits, which is currently in beta, you are able to check not only which activities both paid and non-paid bring the most results online but also which of them contribute to the increase of visits at your physical store.
Who is it for?
According to Google data on the automotive industry nine out of ten of new car buyers will research online before making a purchase. Of these, 78% start with search, but only 26% fill out an online lead form. For many other industries, the situation is similar, which is why it is crucial to be able to measure what happens after visiting our website.
Businesses will benefit most from this data if they rely on visits to physical locations. Like hotels, auto dealerships, and retail stores. Having access to data in Store Visits reports, marketing teams will be able to leverage store visit data to craft more successful online marketing campaigns.
How does it work?
In simplified terms, it works as in the following graphic:
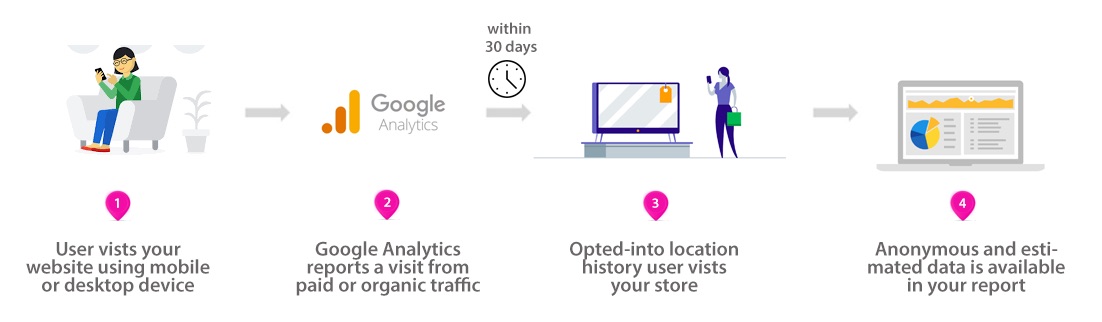
How does Google know that a person visiting your website is also visiting your physical store?
If the visitor was on your website, Google Analytics records this as a visit. Then, if a user visits your stationary point of sale using a phone with enabled location history Google is able to associate it with an earlier visit to the website.
But what if the visit to the website was carried out using a device other than the mobile phone with which the user came to the store?
Here, Google Signals technology comes to the fore with which Google is able to link visits from different devices to the same user. If the user visited your website on the desktop computer on which he was logged into the Google account, Google is able to associate the desktop and mobile device with the same user.
So if the user was on your website and later visited your physical location within 30 days, the credit for this visit will be attributed to the same traffic source as the visit to the website. Isn’t that great?
Case studies
After launching the Store Visits report in Google Analytics, advertisers are able to report to what extent their activities are attracting users to stationary stores and estimate how this translates into their business.
Before the implementation of the Store Visits report, a similar report was available in the Google Ads tool, but it was limited to being able to check only the impact of Google campaigns on offline visits. The Google Analytics report does not have this limitation. Both paid and non-paid traffic sources are reported for offline visits. What influence marketing activities may have on the results in stationary stores is suggested by examples from the British market
BMW UK has invested in Google Ads to attract customers to its car dealerships. Result?“3.5% of paid clicks resulted in a physical visit within 30 days across 146 dealerships. BMW UK estimated 173:1 return on investment on its search marketing campaigns.” You can read more about it here.
The second case is from Nissan UK. “The company saw a 4.77% conversion rate from clicks on search ads to store visits, a 6.04% conversion rate on mobile, and it now enjoys an ROI of £25 for every pound spent.” Marc Palmer, Nissan UK Marketing Manager said, “Now we are able to find out that someone searched for us and then they went and bought a car – that’s kind of getting close to the Holy Grail.” You can read more about it here.
In the third case also Hyundai UK and AdWords store visits data proves that search marketing investment drives in-store visits. “The test demonstrated that the campaigns contributed 303,131 monthly visits to website and 7,980 monthly visits to physical dealer locations, which translated to 52 visits per retailer across 157 locations. An incredible 3.4% of paid clicks resulted in a dealership visit in 30 days. For mobile, the rate was 4.9%.” You can read more about it here.
What are the requirements?
Below is a list of official requirements that must be met to access the Store Visits report in Google Analytics. Google did not specify how many physical stores we should have and how much offline traffic should be.
General requirements
Have Analytics, Google Ads, and Google My Business accounts.
Have multiple physical store locations in eligible countries.
Have high volumes of store visits data to attribute to website traffic.
Analytics requirements
Have activated Google signals.
Have your Analytics property linked to at least one Google Ads account that contains location extensions from Google My Business.
All Google Ads accounts linked to your Analytics property must have the same location extensions.
Google Ads requirements
Have at least 90% of your linked locations verified in Google My Business.
Ensure location extensions are active in your Google Ads account.
Where to find reports?
If you meet all Google requirements for Store Visits reports, a new report section will appear in our Google Analytics. Reports will appear in the Conversions panel:
You will get access to three reports:
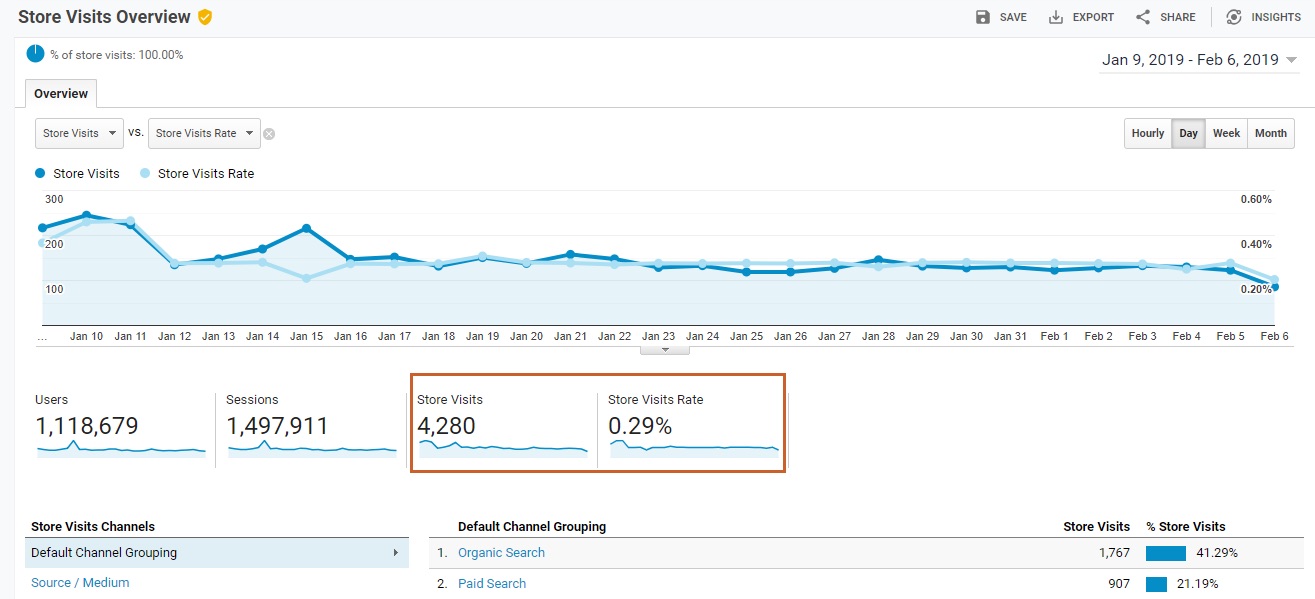
Store Visits Overview – where you are able to find out how many people visit your store after visiting our website:
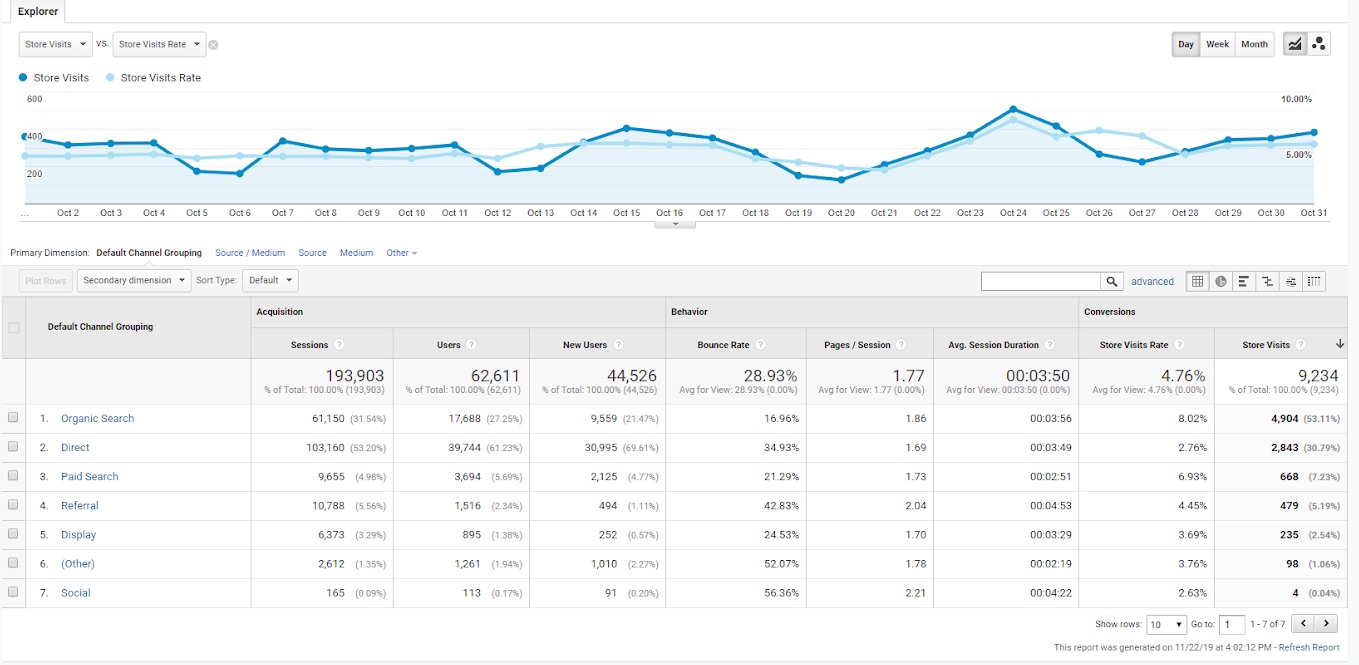
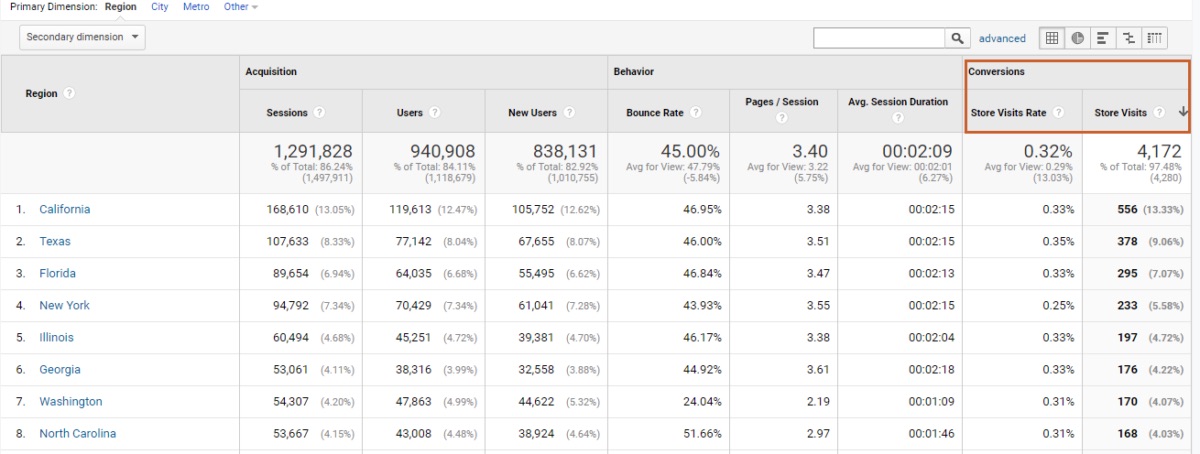
Store Visits Channels – where you are able to find out through which channel, source, or campaign we obtain the most – and most effective – visits to offline stores
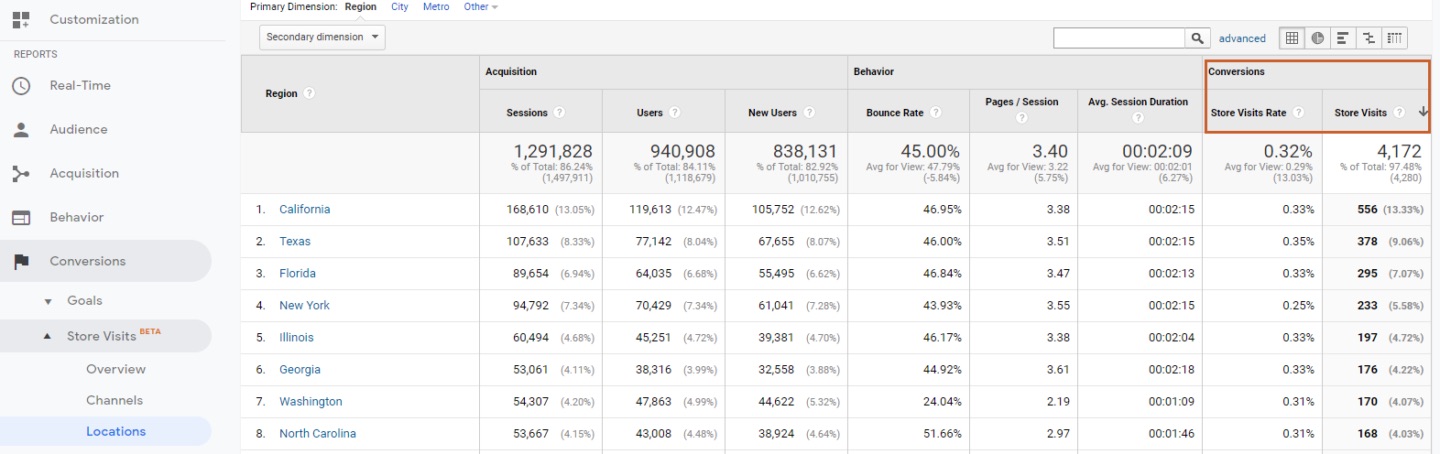
Store Visits Locations – where you are able to find out where your store visits come from and use a report similar to using the standard Geo report in Google Analytics.
What you have to remember:
After meeting all set-up requirements, Google needs about 90 days to generate the first report.
The data collected in Google Analytics is anonymous data and estimated because tracking the location changes of named individuals is prohibited by the law.
Google hasn’t got data about how many of the visitors buy from your store.
You can’t measure all visits. If the user has turned off location history, the store visit is not reported.
Not every visit is equal. Some visits to a stationary point may take a few seconds, others a half hour.
According to official guidelines, you must have a Google Ads account. The report itself, however, reports results from all traffic channels, not just Google Ads campaigns. So I suspect that the lack of a Google Ads account should not affect the operation of this report for other traffic sources. Otherwise, it would be unethical to act like that on the Google side
If you need more information, you can look here.